Diversity, Equity, & Inclusion: Collection Audit
What is a diversity audit?
The purpose of a diversity audit is to find the percentage of our collection that reflects something other than the mainstream American (in this case) experience.
The goal is to increase this percentage in order to better represent marginalized groups.
Types of Diversity
- Race, Ethnicity, Nationality: Black, Asian, Latinx, Indigenous, Arab, refugees and immigrants, multicultural, mixed race, passing
- Gender: roles, bias, nonbinary
- LGBTQIA+: queer, trangender, asexual, intersex
- Family Structures: same sex parents, interracial families, blended/step families
- Socioeconomic: class, poverty, homelessness, incarceration
- Physical Disability: hearing or sight impairments, disfigurement, limb loss, use of aids
- Mental Health & Neurodiversity: bipolar, depression, schizophrenia, ADHD, autism spectrum, addiction, dyslexia
- Culture & Religion: Atheist, Christian*, Hindu, Jewish, Muslim, Buddhist, Wiccan
- Violence: victims of hate crimes, police brutality, human trafficking, rape, abuse
*Depending on where you are located, Christianity might not be a "diverse" perspective. I've included it here because it can be helpful to compare the other religions to it.
For this audit we will be using Library of Congress Subject Headings (LCSH).
Benefits of LCSH
- LCSH is a controlled vocabulary
- Subjects are easily accessible in the bibliographic record
- Using a computer saves time
- Can assess many items (the collection I'm analyzing is over 350,000 items)
- Results in concrete data, which can then be used to create graphs and dashboards
Caveats and Things To Consider
- This collection audit works better for adult collections in public libraries. A children's picture book, for example, might feature a Black person on the cover, but not be about Black people, and therefore would not be captured in this audit. However, representation is still very important for kids and the book would likely be considered "diverse" by many librarians.
- Finding authentic, or #ownvoices works. The subject headings identify the content of the item, but do not describe the background of the author.
- Who is deciding the categories and what subjects go where?
- Where do Afghanistan and Pakistan go? In the South Asia category or the Middle East category?
- Does Neurodiversity go with Disabilities? What is the difference between that and Mental Health?
- LCSH can have problematic or outdated terms
- "Illegal immigration" was recently the subject of much controversy.
- It is difficult to weed out negative representations or tropes.
- White Savior, Magical Negro
- Islam and terrorism
- LCSH is not always completely representative of a work. Take, for example, Black Food by Bryant Terry:
Table of Contents
Prologue: Spirit
- Motherland
- Migrations
- Spirituality
- Leisure & Lifestyle
- Land, Liberation, & Food Justice
- Black Women, Food, & Power
- Black, Queer, Food
Interlude: Self-Care
Conclusion: Black Future
Subject Headings
- Food habits–United States
- African Americans–Food
- African American cooking
- Cooking, African
- Cookbooks
(How boring!)

Let's get started!
Supplies
- A computer with internet access
Knowledge
- Python
- Regular Expressions
- Library of Congress Subject Headings
Process
- Create categories of diverse topics and term that fall into those categories.
- Get your library's bibliographic data–specifically the subject headings for each item.
- Open Excel and look at your data. I really can't stress this part enough.
- Clean and prepare your data.
- Start writing regular expressions that will match your diverse subject headings.
- Sort each library item into a category, including a “none” category if no subjects match the diverse regex terms.
- Determine the totals for each category, and calculate percentages.
- Graph it!
Walkthrough
Because I have a lot of categories, the code gets quite long in some places. I'll only put small bits here to illustrate what we're doing, but you can find the full code on my github.
First, let's take a look at how my data is structured. I have four files, with columns defined below.
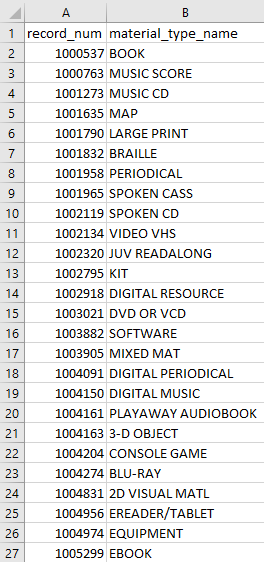
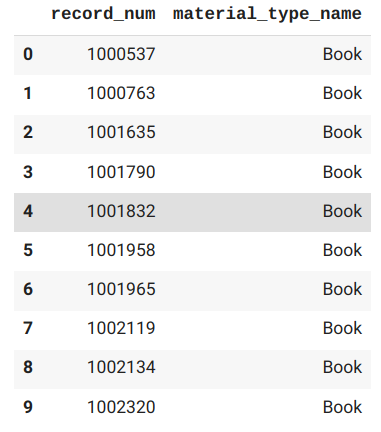
- Bibliographic Records. Bib records have information about the work itself, such as the title and author.
- record_num: contains the unique identifier for each bib record.
- material_type_name: will be used to group like materials. For example, Blu Rays and DVDs can go into one "Movie" category.
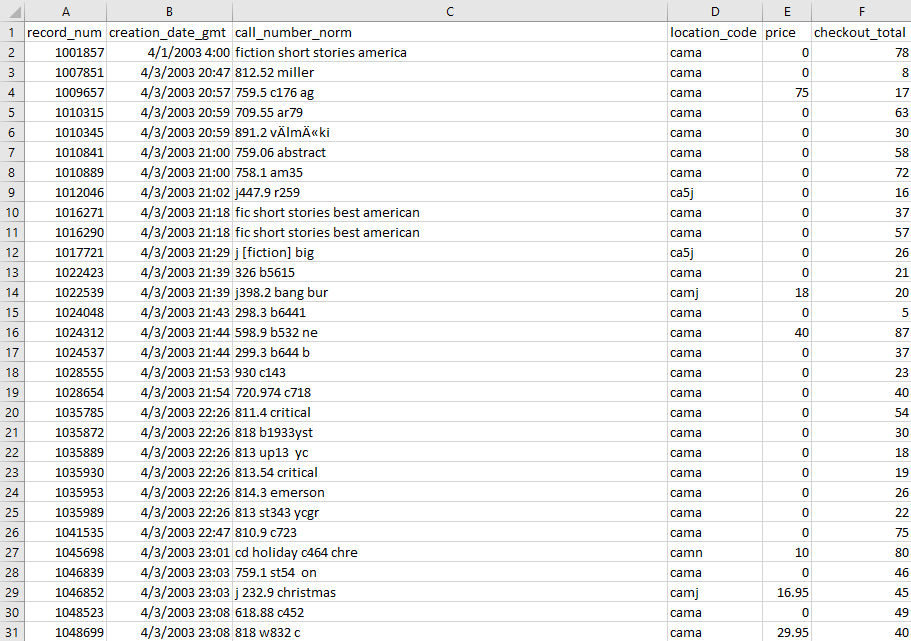
- Item Records. Item records have information about each physical copy, such as call number and the total number of checkouts. A bib record can contain many item records–one for each copy of the work the library owns.
- record_num: contains the unique identifier for each item record.
- creation_date_gmt: the date that the item was cataloged. This will be used to get the approximate age of the item (time on the shelf).
- call_number_norm: the normalized call number will be used to separate fiction from nonfiction.
- location_code: gives us the branch and audience (adult, young adult, juvenile) for the item.
- price:will be used to find the average price in a group of items.
- checkout_total:will be used with the creation date to find the average number of checkouts for a given timeframe.
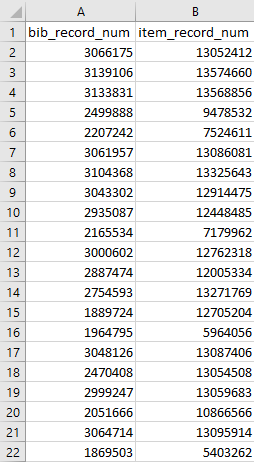
- Record Link. We will use this to match up the Item Records information and the Bib Records information.
- bib_record_num
- item_record_num
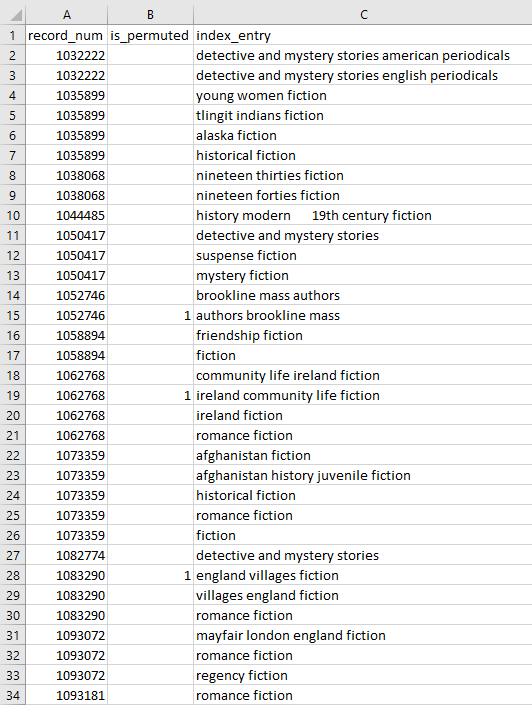
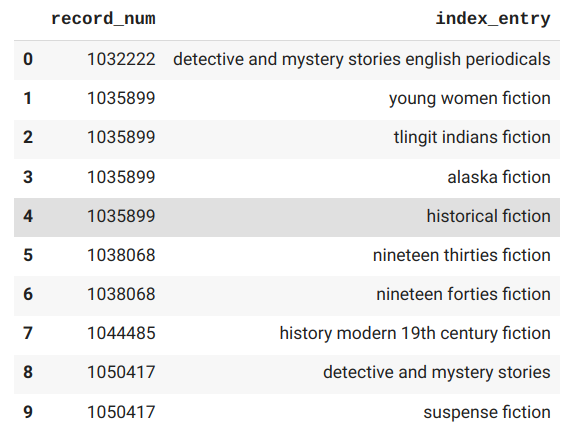
- Phrase Entry. This file contains all the subject headings for each bib record.
- record_num: is the bib record number, since subject headings are in the bibliographic record, not the item record.
- is_permuted: the subject headings in this column have had the order of their words changed to facilitate indexing. It effectively duplicates our data, so we will use it to cut out the duplicates and lower our file size.
- index_entry: contains the actual subject headings.
Now, I actually have eight Phrase Entry files–one for each branch of the library. This is because if I try to run a report to get all the information at once, the report will time out. If you've got all your data together already, you can skip this part.
To start combining these files into one, we'll first make a CSV with the names and extensions of each file (one on each line, no header).
Next we're going to loop through this list and append the information contained in each file to a new CSV. We'll ignore the headers for now because we don't want eight lines of headers in our new file.
import pandas as pd

getFile = pd.read_csv('filename.csv', names=['a'], header=None)
nameList = getFile['a'].tolist()

for x in range(len(nameList)):
    inputFile = pd.read_csv(nameList[x])
    inputFile.to_csv('phraseALL.csv', mode='a', header=False, index=False)
Ok, now let's put the header back in.
newFile = pd.read_csv('phraseALL.csv')
headerList = ['id', 'record_id', 'record_type', 'record_num', 'occurrence', 'is_permuted', 'index_entry', 'original_content', 'insert_title']

newFile.to_csv('phraseALL.csv', header=headerList, index=False)
All done! We now have all our subject heading information in one file, which will make it much easier to work with in the next part.
Now the real work begins. Strap in, because we are going on a JOURNEY.
To start with we are going to import our libraries.
import pandas as pd
import regex as re
import datetime
import pytz
import numpy as np
Read in the CSV files I described above.
dfPhraseLoad = pd.read_csv('phraseALL.csv', usecols=['record_num', 'is_permuted', 'index_entry'], dtype={'record_num':int, 'is_permuted': str, 'index_entry': str})

dfBibLoad = pd.read_csv('Bibs.csv', usecols=['record_num', 'material_type_name'], dtype={'record_num': int, 'material_type_name': str})

dfItemLoad = pd.read_csv('Items.csv', usecols=['record_num', 'creation_date_gmt', 'call_number_norm', 'location_code', 'price', 'checkout_total'], dtype={'record_num': int, 'creation_date_gmt': str, 'call_number_norm': str, 'location_code': str, 'price': float, 'checkout_total': int})

dfLinkLoad = pd.read_csv('RecordLink.csv', usecols=['bib_record_num', 'item_record_num'], dtype={'bib_record_num': int, 'item_record_num': int})
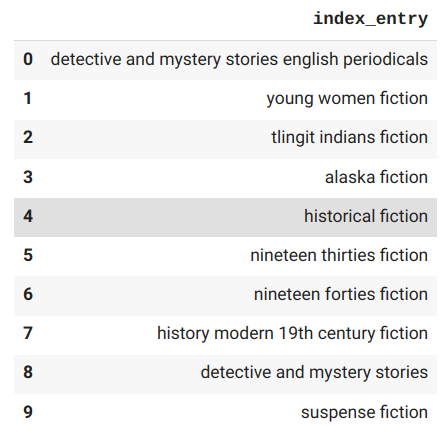
Let's make our giant subject heading lists a little more workable. dfPhraseFull keeps the bib record numbers so that it can merge with the bib report later. dfPhrase drops the bib records so that we can then drop duplicate subject headings (because some books are about the same thing). This makes the lookups we are going to do much faster.
dfPhraseFull = dfPhraseLoad.loc[dfPhraseLoad['is_permuted'].isnull()].reset_index(drop=True)

dfPhraseFull = dfPhraseFull.drop(['is_permuted'], axis=1)

dfPhrase = dfPhraseFull.drop(['record_num'], axis=1)

dfPhrase = dfPhrase.drop_duplicates(subset=['index_entry'])
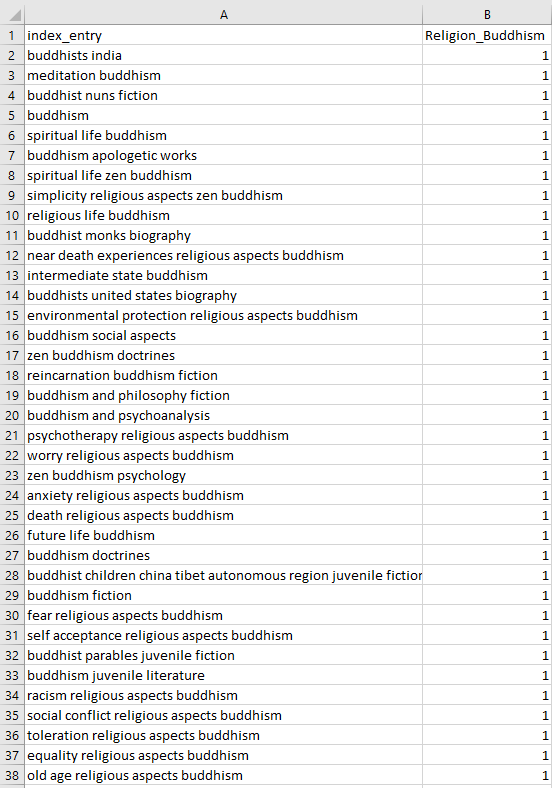
Create a regular expression for each one of your categories. Below you'll find the simple one I made for Buddhism.
rel_buddPat = r'(\bzen\b)|(dalai lama)|(buddhis)'
Refining the regex takes a lot of trial and error. Just keep looking at the actual data (I'll show you when to do that below), and adjust accordingly.
For now, compile the regex.
BUDcomp = re.compile(rel_buddPat)
Initialize lists for the categories.
BUDlist = []
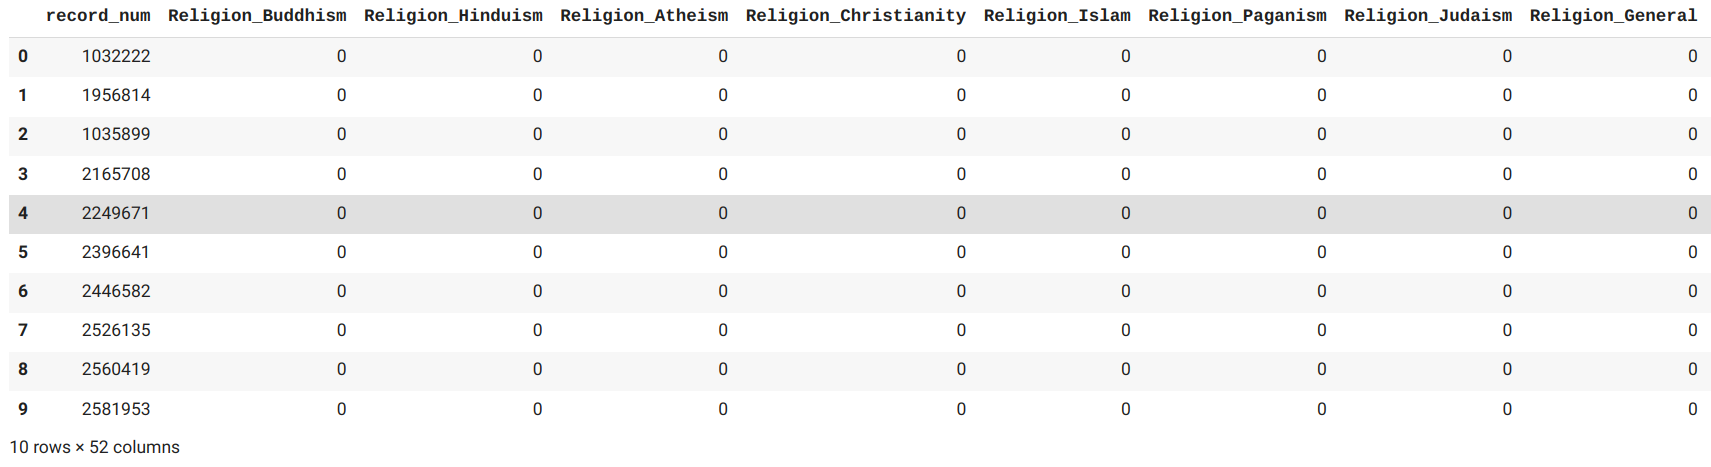
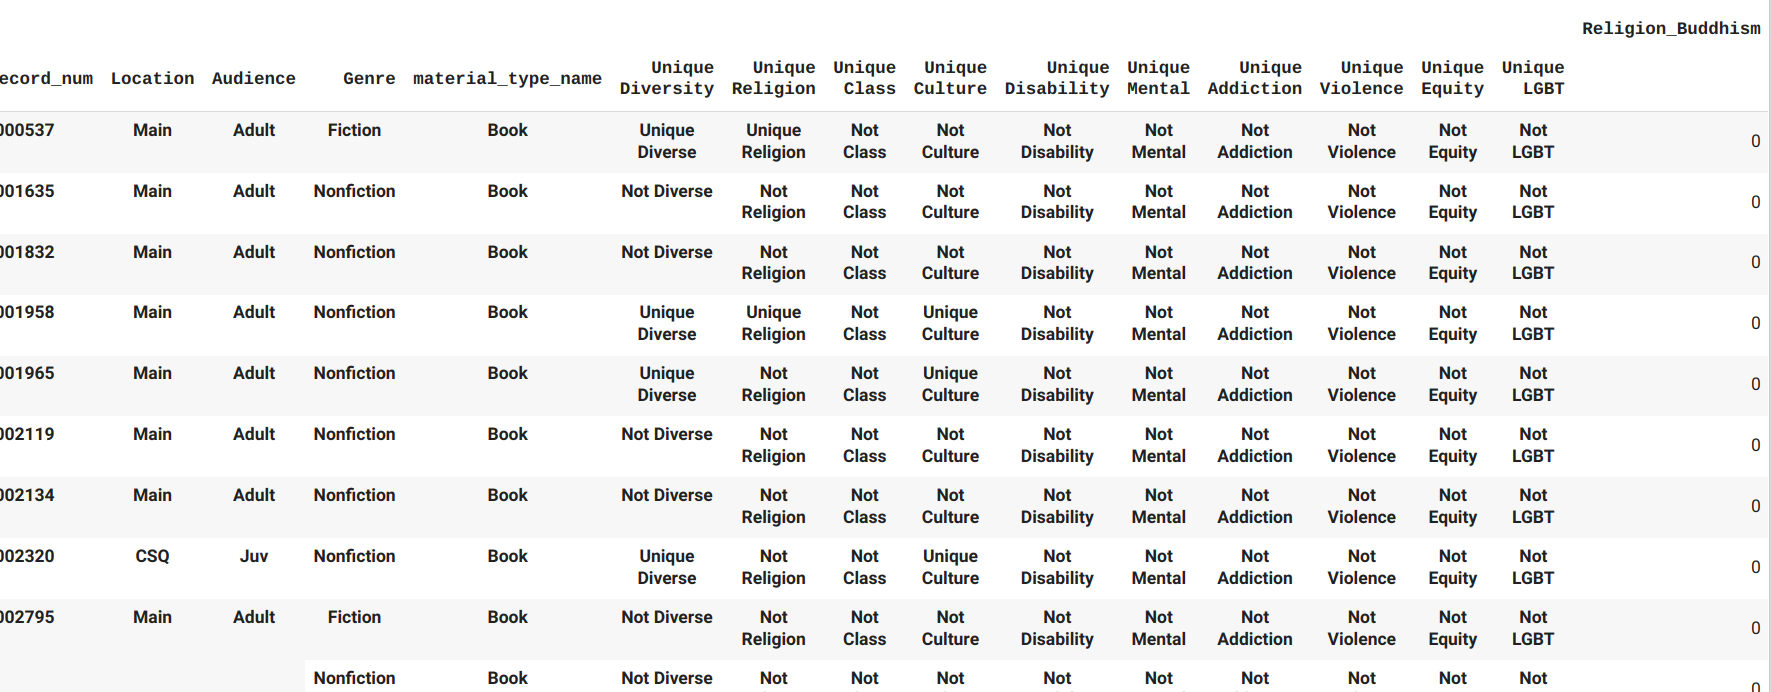
Finally, we're going to create a table. Each row will be a subject heading, and each column will be one of your diverse categories. We are going to run through the list of subject headings and put a 1 (True) or 0 (False) in each column depending on whether that subject falls into the category.
We'll start just inserting the information into lists.
BUDlist = [int(bool(BUDcomp.search(x))) for x in dfPhrase['index_entry']]
Then we convert the lists into dataframe columns. Our dataframe/table is called dfPhrase.
dfPhrase['Religion_Buddhism'] = BUDlist
We'll export this boolean dataframe to a CSV to check whether our regex is working.
dfPhrase.to_csv('phraseBools.csv', index=False)
Switching gears for a moment, we are going to set up our bib records in preparation for merging all the information from our four files together.
Here we are combining material types into more usable categories, and dropping the ones we don't need. This will ultimately allow us to create a "Material" filter in our dashboard.
dfBib = dfBibLoad.replace({'material_type_name':{'BLU-RAY':'Movie', 'DVD OR VCD':'Movie', 'JUV READALONG':'Book', 'BOOK':'Book', 'LARGE PRINT':'Book', 'PLAYAWAY AUDIOBOOK':'Audiobook', 'SPOKEN CD':'Audiobook'}})

dfBib = dfBib.loc[dfBib['material_type_name'].isin(['Book','Movie','Audiobook'])].reset_index(drop=True)
Time to merge stuff! Start by merging the two phrase dataframes we made before (like a vlookup). Then the phrase (subject heading) column can be dropped, since we don't need it anymore.
newPhrase = pd.merge(dfPhraseFull, dfPhrase, on='index_entry')
newPhrase = newPhrase.drop(['index_entry'], axis=1)
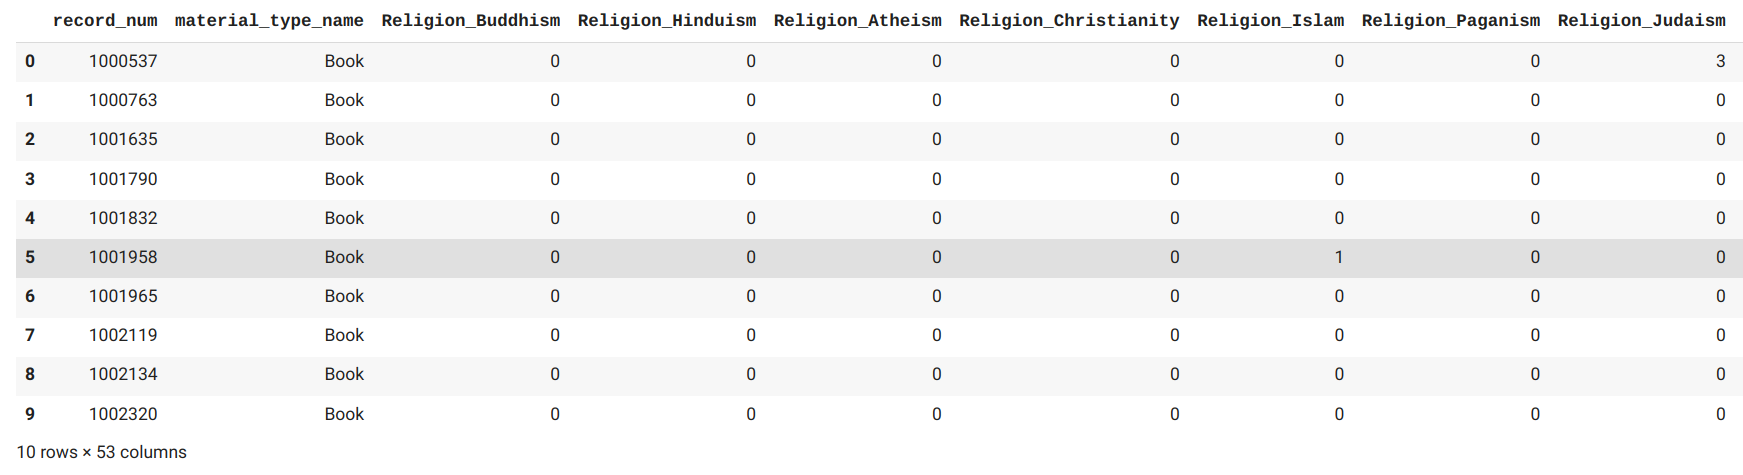
Now merge newPhrase with the bib records. Then condense the new dataframe using groupby.
We're doing this because items will often have several subject headings. For example, if a book about Buddhism has three subjects, and all of them make it into our Buddhism category, we really don't need three lines. The groupby makes one line for each bib record and adds up the number of 1's it had in each category.
After this you can try to use the highest count in a column to assign a primary category, since a book could potentially fall into several categories at once. But for now we will move on.
bibSubjects = pd.merge(newPhrase, dfBib, on='record_num')

bibSubjectsCond = bibSubjects.groupby(['record_num','material_type_name']).sum().reset_index()
Now, if you've set up your categories like me, you'll have top categories and subcategories. Here we are grouping up like categories.
religionList = ['Religion_Buddhism', 'Religion_Hinduism', 'Religion_Atheism', 'Religion_Christianity', 'Religion_Islam', 'Religion_Paganism', 'Religion_Judaism', 'Religion_General']
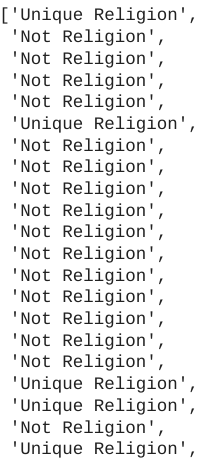
Because a book might fall into more than one of these categories–for example, it might be about both Buddhism and Hinduism–we have to prevent counting things twice. That is, we have to find the number of unique items in each top category.
relArr = bibSubjectsCond[religionList].to_numpy()
sumRelArr = np.sum(relArr, axis=1).tolist()

relOutput = []
relOutput = ['Unique Religion' if sumRelArr[x] > 0 else 'Not Religion' for x in range(len(sumRelArr))]

bibSubjectsCond['Unique Religion'] = relOutput
Now we're going to connect our bibSubjectsCond dataframe with our Item dataframe using the Record Link. If you're familiar with SQL, you'll recognize the joining going on.
recLink = pd.merge(bibSubjectsCond, dfLinkLoad, left_on='record_num', right_on='bib_record_num').reset_index(drop=True)
recLink = recLink.drop(['record_num'], axis=1)
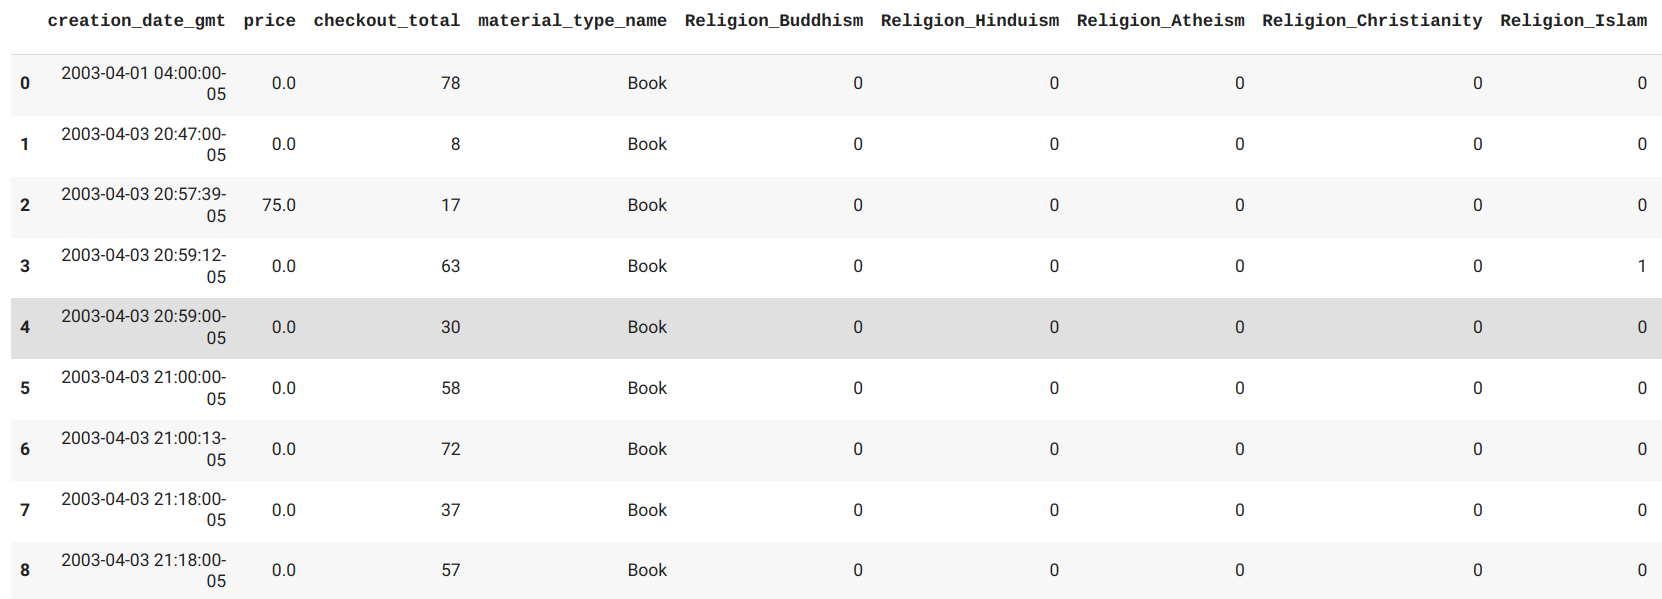
newItem = pd.merge(dfItemLoad, recLink, left_on='record_num', right_on='item_record_num').reset_index(drop=True)
newItem = newItem.drop(['record_num'], axis=1)
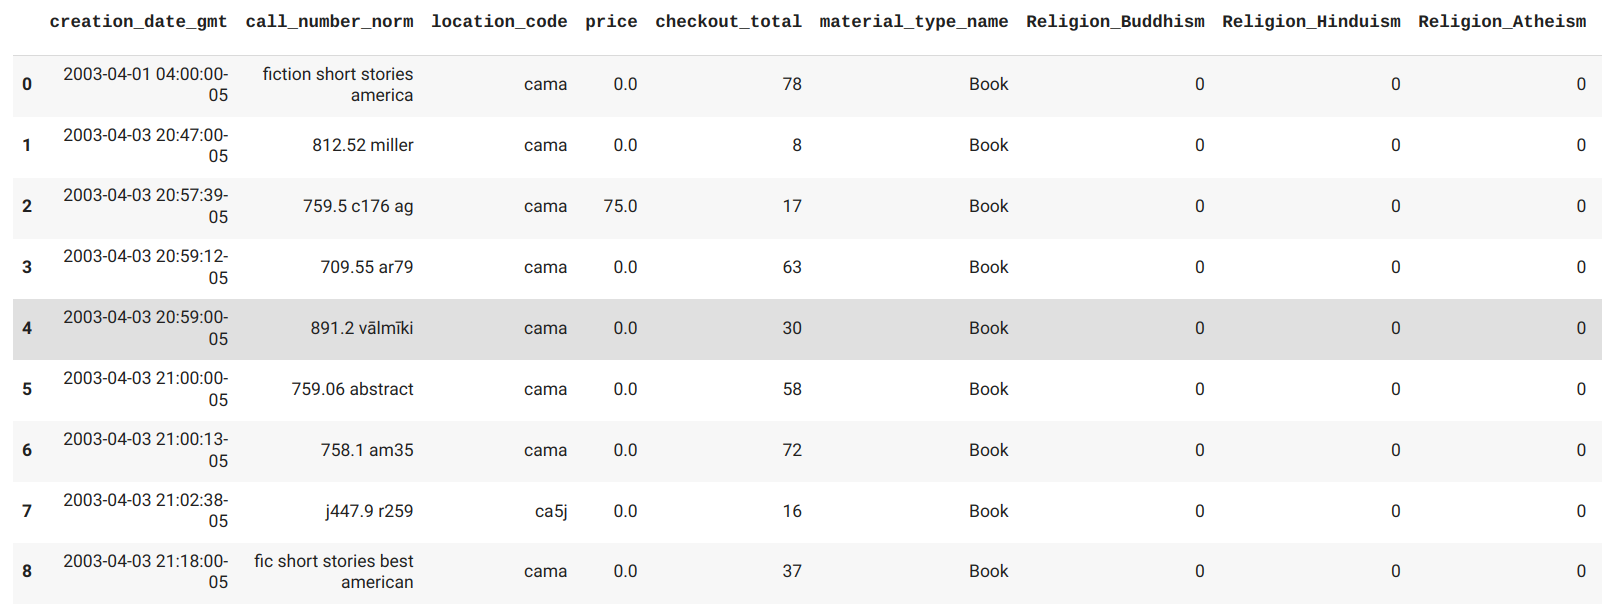
Assign Fiction or Nonfiction genre using the item call numbers. We are doing this so we can compare the two groups in our dashboard.
nfPat = r'((.*\d\d\d.*)|(.*poetry.*)|(^jb.*))'
NFcomp = re.compile(nfPat)
GenreList = []
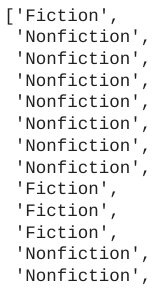
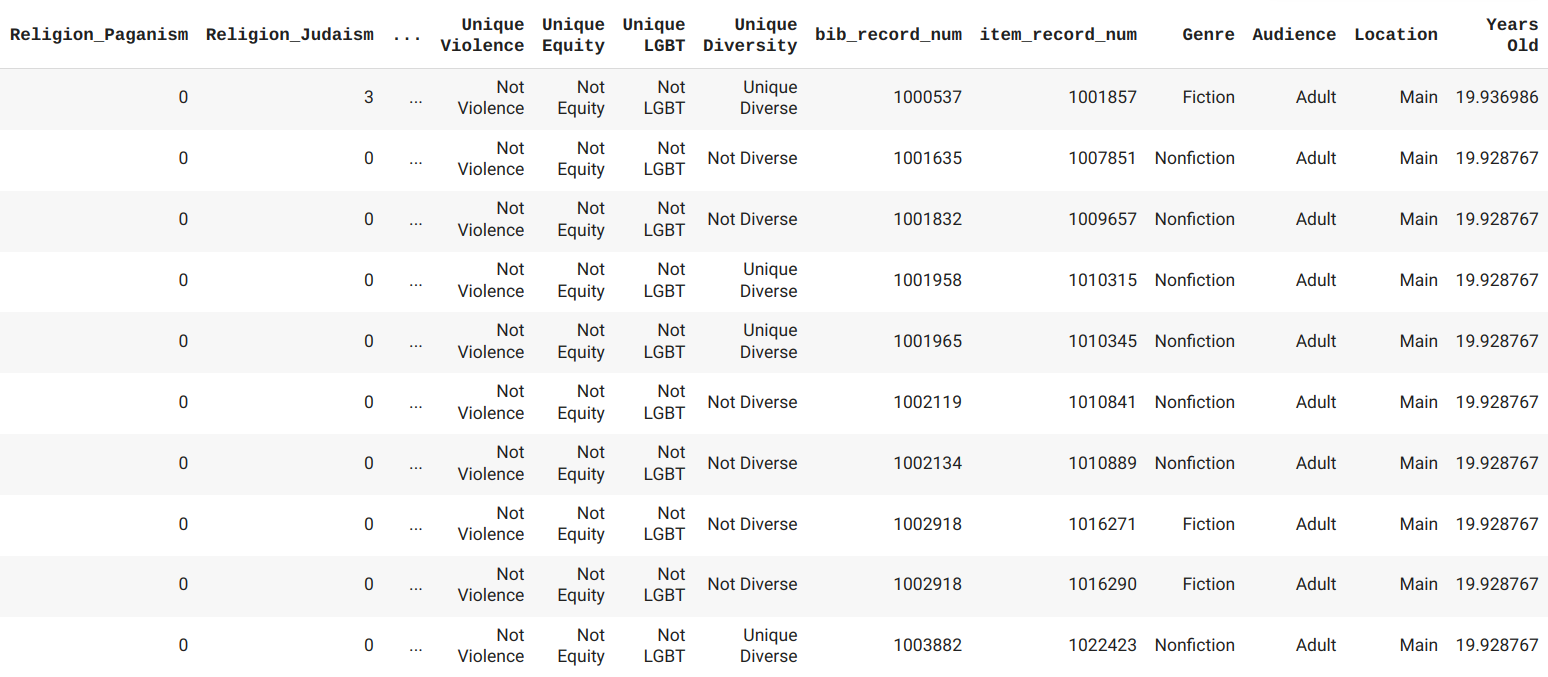
GenreList = ['Nonfiction' if NFcomp.search(x) else 'Fiction' for x in newItem['call_number_norm'].astype(str)]
newItem['Genre'] = GenreList
Get branch location and audience from location code. We need the full 4-character code, so drop ones with only three characters (they have been entered wrong). Like the material types, we are doing this to create filters in our dashboard.
Merge into the final dataframe and drop unnecessary columns.
newItem = newItem[newItem['location_code'].apply (lambda x: len(str(x)) > 3)]

locs = newItem.filter(['location_code'], axis=1)
locs = locs.drop_duplicates(subset=['location_code'])

AudList = []
AudList = ['Juv' if x[3] == 'j' else 'YA' if x[3] == 'y' else 'Adult' for x in locs['location_code']]

LocList = []
LocList = ['Main' if x[2] == 'm' else 'Outreach' if x[2] == '3' else 'Boudreau' if x[2] == '4' else 'CSQ' if x[2] == '5' else 'Collins' if x[2] == '6' else "O'Connell" if x[2] == '7' else "O'Neill" if x[2] == '8' else 'Valente' if x[2] == '9' else 'Other' for x in locs['location_code']]

locs['Audience'] = AudList
locs['Location'] = LocList

finalItem = pd.merge(newItem, locs, on='location_code')
finalItem = finalItem.drop(['call_number_norm', 'location_code'], axis=1)
Convert creation date to datetime object and get the age of item.
finalItem['creation_date_gmt'] = pd.to_datetime(finalItem['creation_date_gmt'], utc=True)
today = datetime.datetime.now(tz=pytz.utc)
AgeList = []
AgeList = [(today - x).days for x in finalItem['creation_date_gmt']]
AgeListYears = [x/365 for x in AgeList]
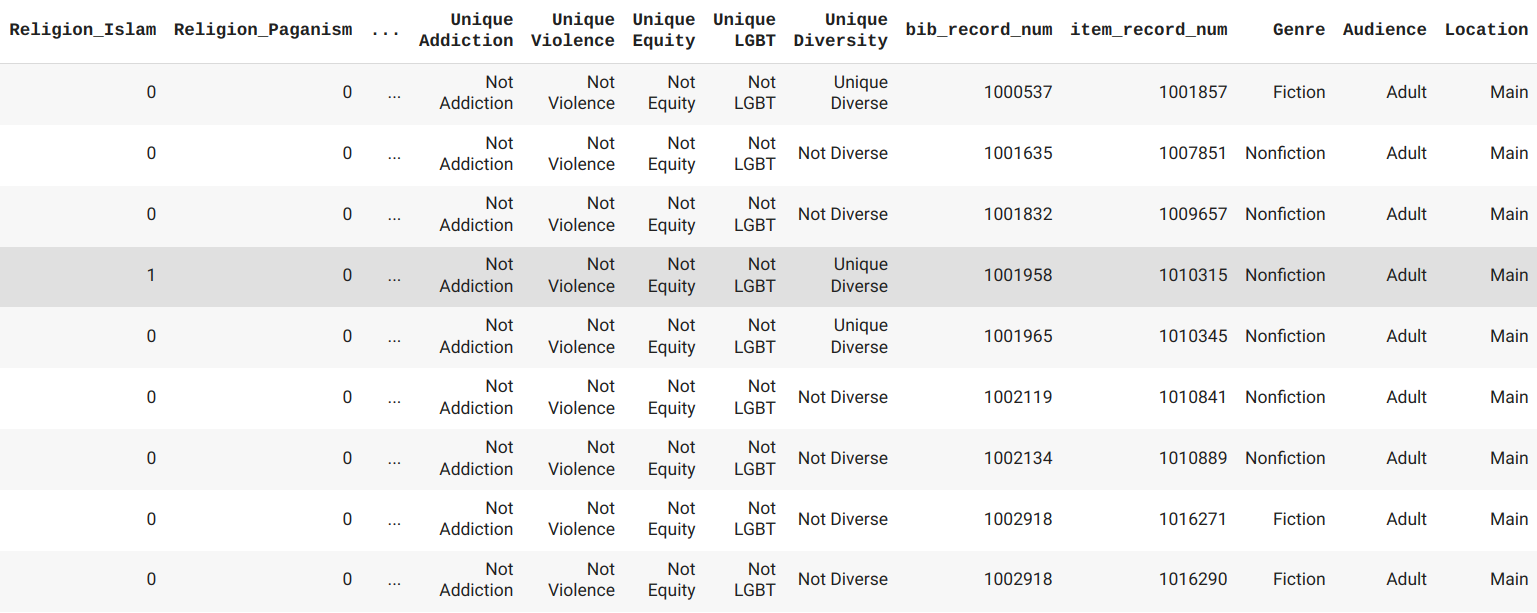
finalItem['Years Old'] = AgeListYears
finalItem = finalItem.drop(['creation_date_gmt'], axis=1)
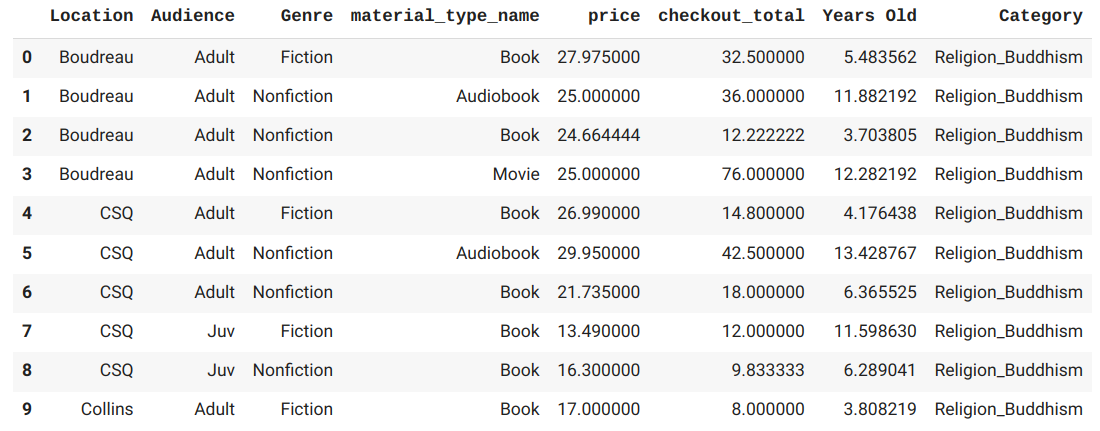
Get averages for age, price, and total number of checkouts.
dfBud = finalItem.loc[(finalItem['Religion_Buddhism'] > 0) & (finalItem['price'] > 0)]
dfBudAvg = dfBud.groupby(['Location', 'Audience', 'Genre', 'material_type_name'])['price', 'checkout_total', 'Years Old'].mean().reset_index()
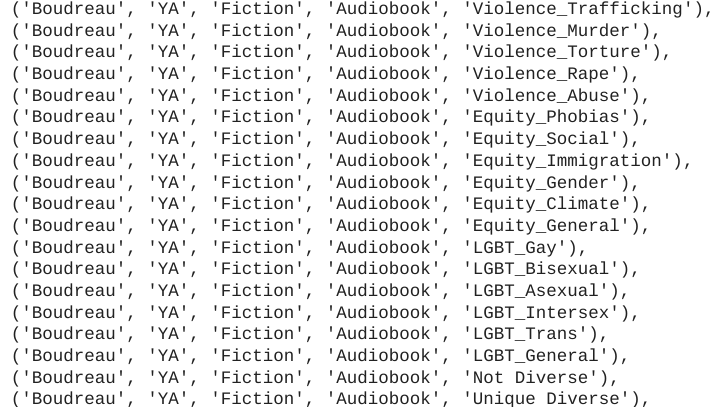
dfBudAvg['Category'] = 'Religion_Buddhism'
...
frames = [dfBudAvg, dfHinAvg, dfAthAvg, dfIslAvg, dfChrAvg, dfPagAvg, dfJudAvg, dfRelAvg, dfClaAvg, dfSAAvg, dfEAAvg, dfIndAvg, dfHisAvg, dfArabAvg, dfBlaAvg, dfMulAvg, dfBliAvg, dfDeaAvg, dfAmpAvg, dfDisAvg, dfAutAvg, dfAnxAvg, dfOCDAvg, dfSchAvg, dfEatAvg, dfDepAvg, dfMenAvg, dfGamAvg, dfDruAvg, dfAlcAvg, dfAddAvg, dfVioAvg, dfHatAvg, dfPolAvg, dfTraAvg, dfMurAvg, dfTorAvg, dfRapAvg, dfAbuAvg, dfPhoAvg, dfSocAvg, dfImmAvg, dfGenAvg, dfCliAvg, dfEquAvg, dfGayAvg, dfBisAvg, dfAseAvg, dfIntAvg, dfTransAvg, dfLGBAvg, dfRel1Avg, dfRel2Avg, dfClass1Avg, dfClass2Avg, dfCult1Avg, dfCult2Avg, dfDis1Avg, dfDis2Avg, dfMen1Avg, dfMen2Avg, dfAdd1Avg, dfAdd2Avg, dfVio1Avg, dfVio2Avg, dfEqu1Avg, dfEqu2Avg, dfLGB1Avg, dfLGB2Avg, dfDivAvg, dfNDAvg]
dfAvgs = pd.concat(frames)
Create a dataframe of distinct bib records. Then convert back to boolean values. (The sum function has added up the values for each item, but to count them later on for the bibs, we just want ones and zeroes.)
dfDisBib = finalItem.groupby(['bib_record_num','Location','Audience','Genre','material_type_name', 'Unique Diversity', 'Unique Religion', 'Unique Class', 'Unique Culture', 'Unique Disability', 'Unique Mental', 'Unique Addiction', 'Unique Violence', 'Unique Equity', 'Unique LGBT'])[catList].sum()

dfDisBib[catList] = dfDisBib[catList].astype(bool)
dfDisBib[catList] = dfDisBib[catList].astype(int)
Count the total unique diverse and nondiverse bibs and put them into the Category column.
dfTotUnique = dfDisBib.groupby(['Location','Audience','Genre','material_type_name', 'Unique Diversity']).size().reset_index(name='Count')

dfTotUnique = dfTotUnique.rename(columns={'Unique Diversity':'Category'})
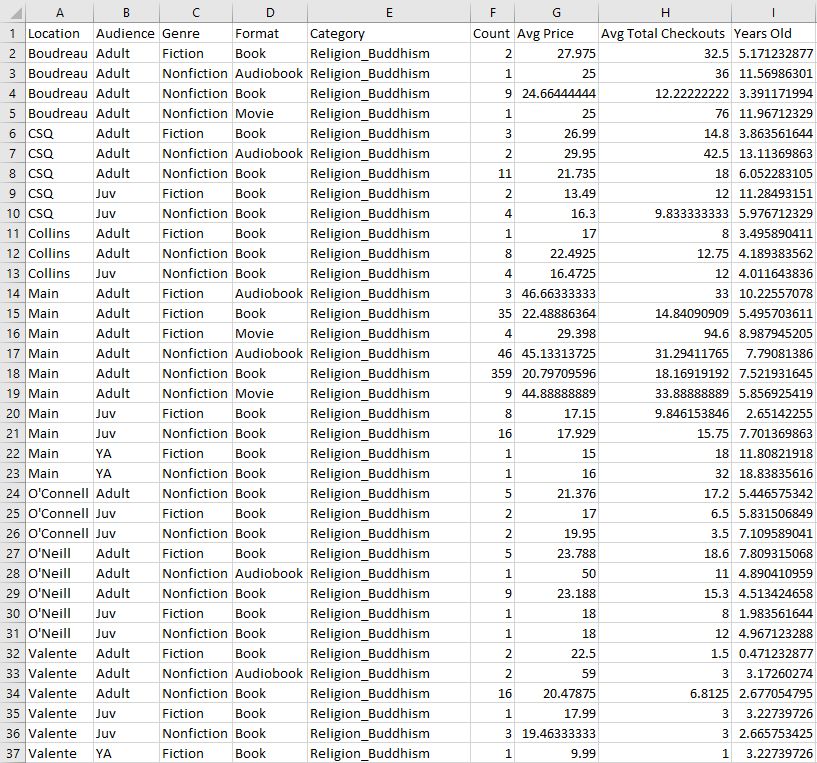
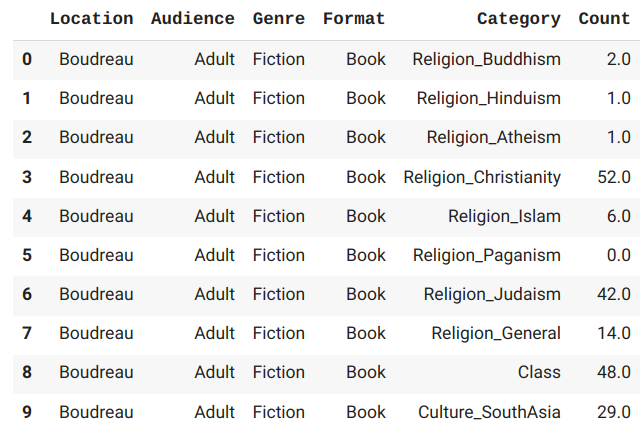
Do a count for each category, then transform data to long format from wide. Add in the counts for the diverse vs nondiverse bibs we just did. Export to csv.
dfCount = dfDisBib.groupby(['Location', 'Audience', 'Genre', 'material_type_name'])[catList].sum().reset_index()

dfMelt = pd.melt(dfCount,id_vars=['Location', 'Audience', 'Genre', 'material_type_name'],var_name='Category',value_name='Count')

framesDF = [dfMelt, dfTotUnique, dfRelUnique, dfClassUnique, dfCultureUnique, dfDisUnique, dfMentalUnique, dfAddictUnique, dfViolenceUnique, dfEquityUnique, dfLGBTUnique]

dfAppend = pd.concat(framesDF, ignore_index=True)

dfMerge = pd.merge(dfAppend, dfAvgs, on=['Location', 'Audience', 'Genre', 'material_type_name', 'Category']).reset_index(drop=True)

dfAggs = dfMerge.rename(columns={'material_type_name':'Format', 'price':"Avg Price", 'checkout_total': "Avg Total Checkouts"})


#I don't know why but Class is being duplicated 4 times. Drop duplicates.

dfAggs = dfAggs.drop_duplicates()

dfAggs.to_csv('aggregates.csv', index=False)
Now we'll use the aggregates file to get some percentages.
In a new Python file, import our libraries and read in aggregates.csv.
import pandas as pd
import itertools

dfAggs = pd.read_csv('aggregates.csv', usecols=['Location', 'Audience', 'Genre', 'Format', 'Category', 'Count'])
Get a list of each unique combination of column data.
cols = ['Location', 'Audience', 'Genre', 'Format', 'Category']

uniqueList = []

for col in cols:
    uniqueList.append(dfAggs[col].unique())

combos = list(itertools.product(*uniqueList))
Count up how many times each combo occurs.
dfBlank = pd.DataFrame(combos, columns = cols)

dfFull = pd.merge(dfBlank, dfAggs, how='left', on=cols)

dfFull['Count'] = dfFull['Count'].fillna(0)
Create lists of what each column's data could be. Don't worry, this will start making sense soon.
branchList = ['Boudreau','Collins','CSQ','Main',"O'Connell","O'Neill",'Valente','Outreach']

audienceList = ['Adult','Juv','YA']

genreList = ['Fiction', 'Nonfiction']

formatList = ['Audiobook','Book','Movie']
Ok, this next part is a bit much, but basically we're finding what percentage each subcategory makes up of the top category. Note that we aren't going to use the "Not ..." category in this part of our dashboard, so just ignore those values.
# Religion

dfReligion = dfFull[dfFull['Category'].str.contains("Religion")]

relList = dfReligion['Category'].unique()

newRelList = []

for b in branchList:
    df1 = dfReligion.groupby('Location').get_group(b)[['Audience','Genre','Format','Category','Count']]

    for a in audienceList:
        df2 = df1.groupby('Audience').get_group(a)[['Genre','Format','Category','Count']]

        for g in genreList:
            df3 = df2.groupby('Genre').get_group(g)[['Format','Category','Count']]

            for f in formatList:
                df4 = df3.groupby('Format').get_group(f)[['Category','Count']]
                tot = df4.loc[df4['Category'] == 'Unique Religion', 'Count'].item()
                if tot == 0:
                    tot = 1

                for c in relList:
                    df5 = df4.groupby('Category').get_group(c)['Count']
                    x = df5.iloc[0]
                    r = [b,a,g,f,c,x,(x/tot)]
                    newRelList.append(r)

dfReligionFinal = pd.DataFrame(newRelList, columns = ['Location', 'Audience', 'Genre', 'Format', 'Category', 'Count','Percent'])
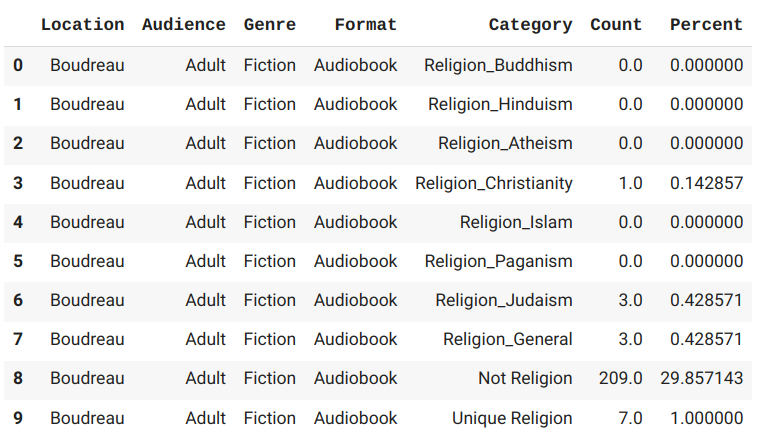
Do the above for each category, then combine them into one dataframe and export to CSV.
framesPer = [dfAddictionFinal, dfCultureFinal, dfDisabilityFinal, dfEquityFinal, dfLGBTFinal, dfMentalFinal, dfReligionFinal, dfViolenceFinal]

dfPer = pd.concat(framesPer, ignore_index=True)

dfPer.to_csv('percents.csv', index=False)
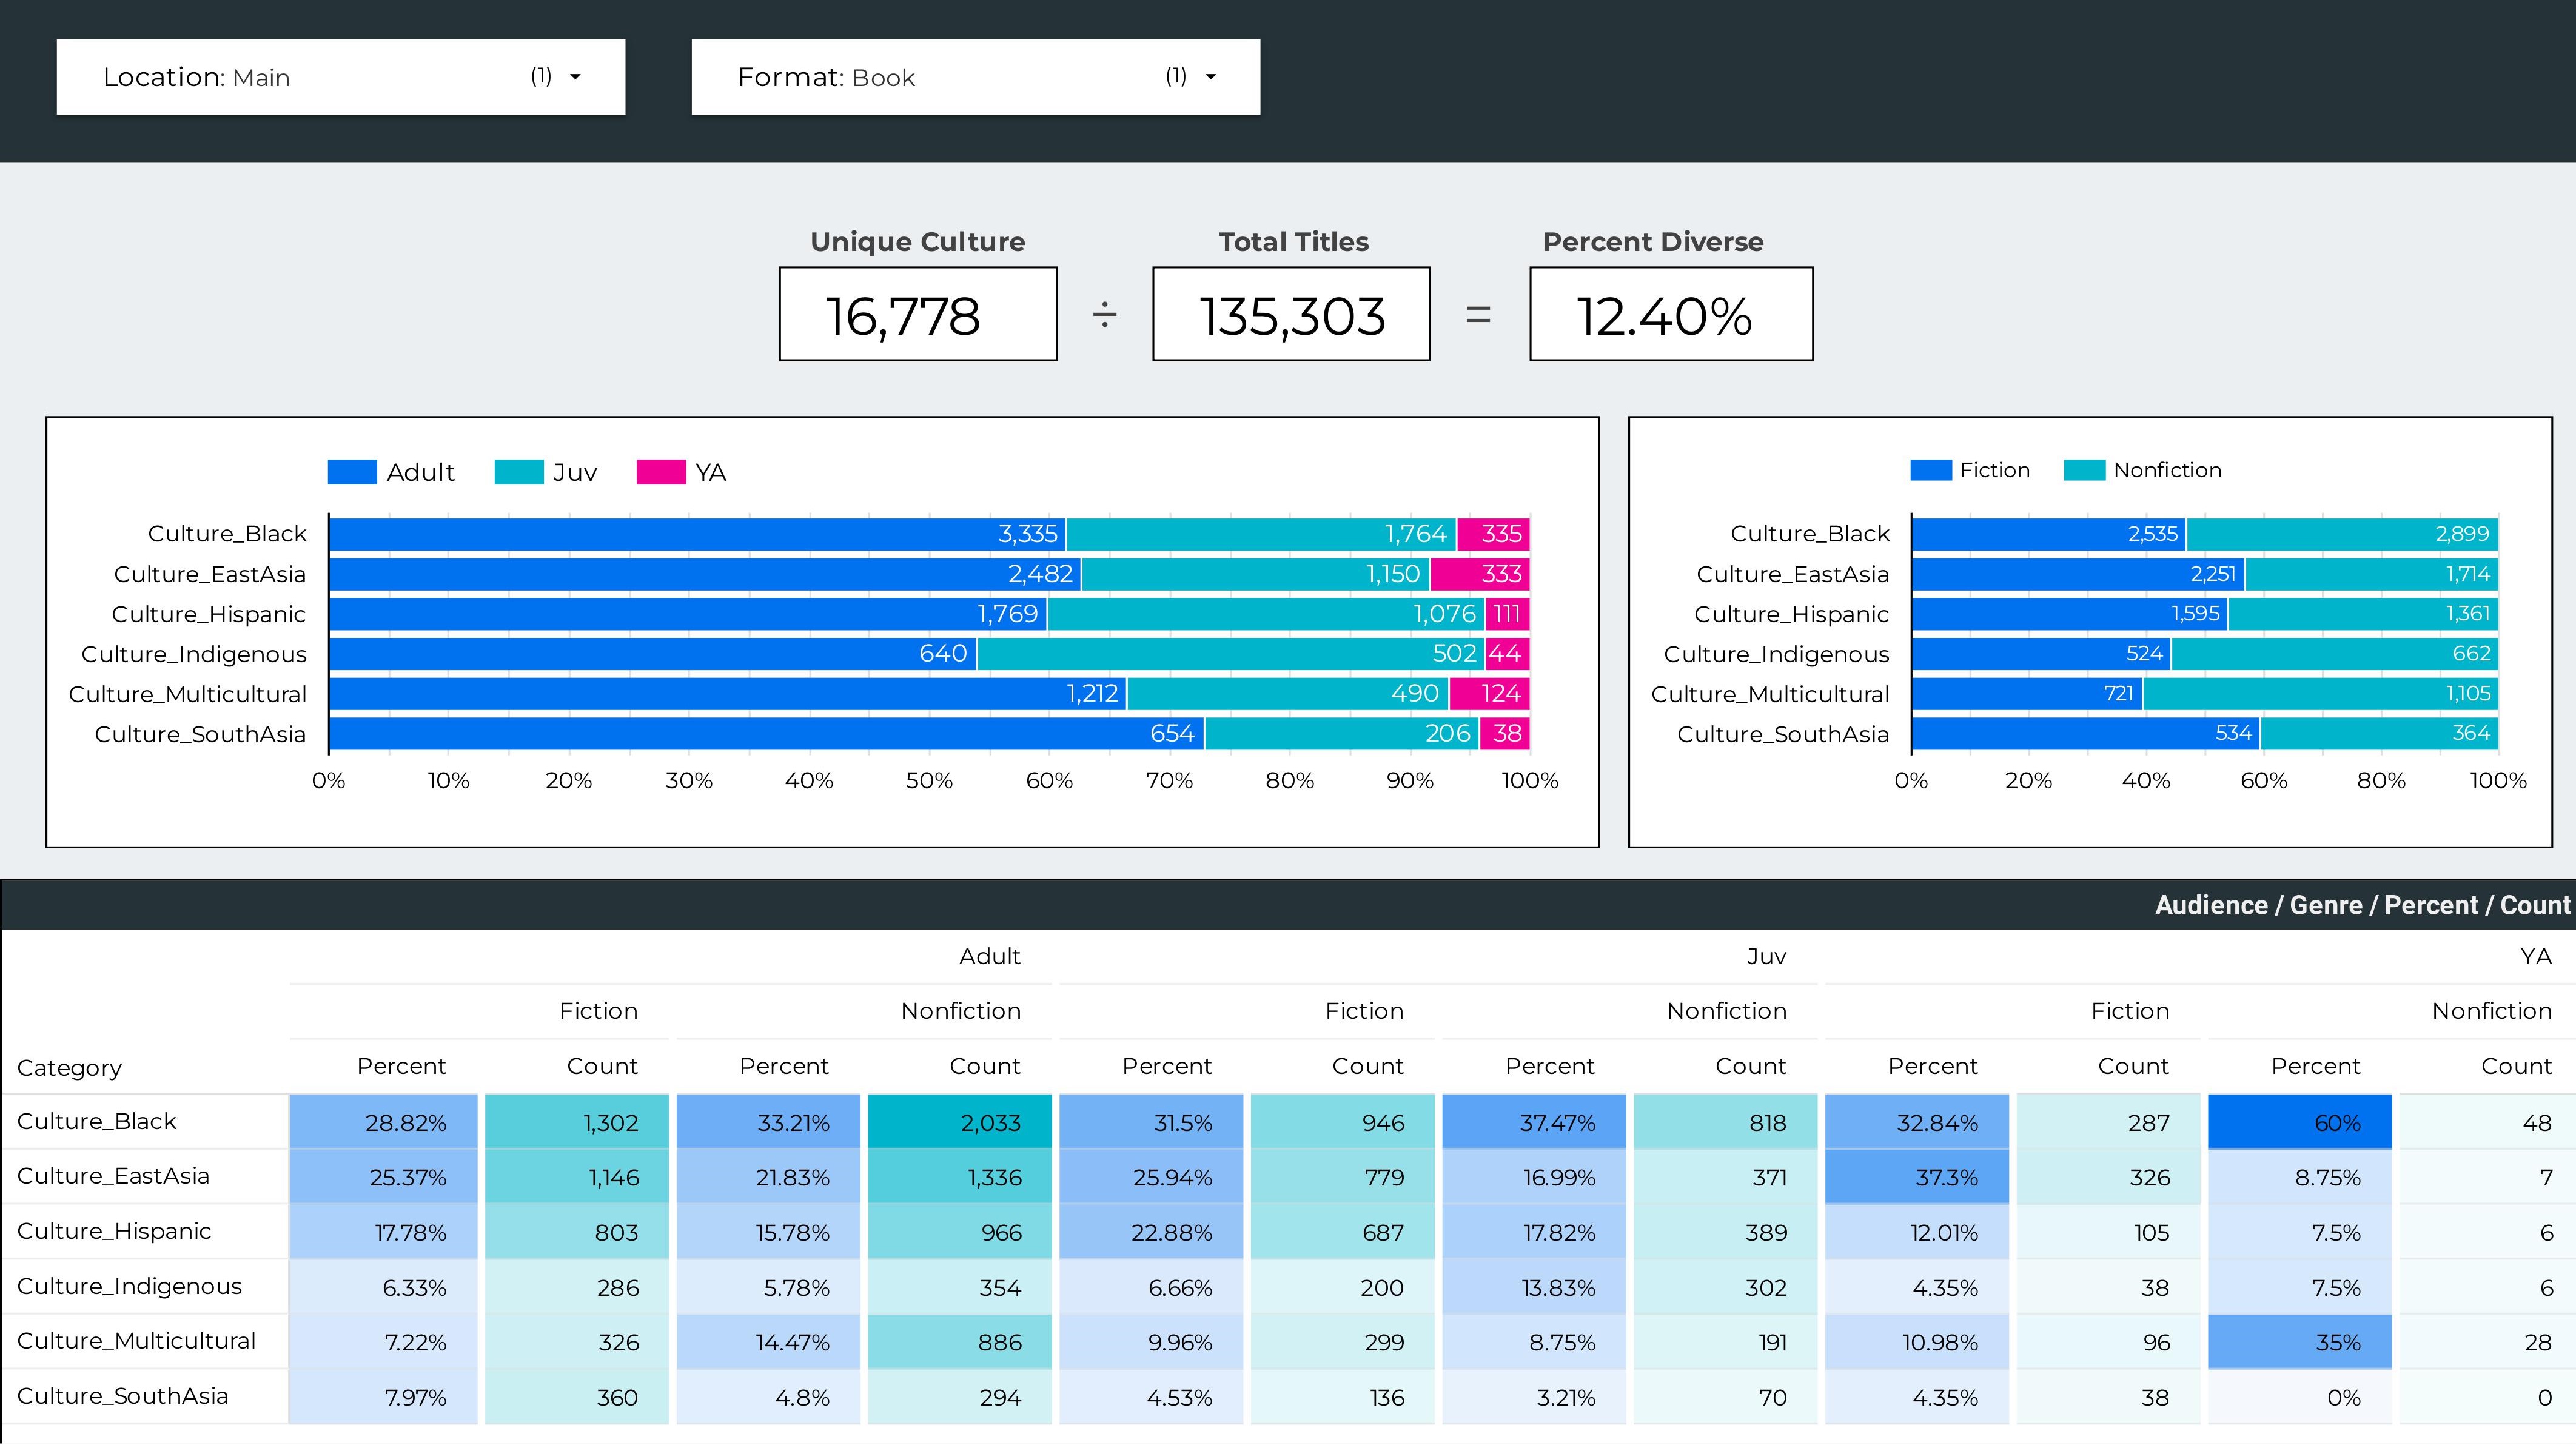
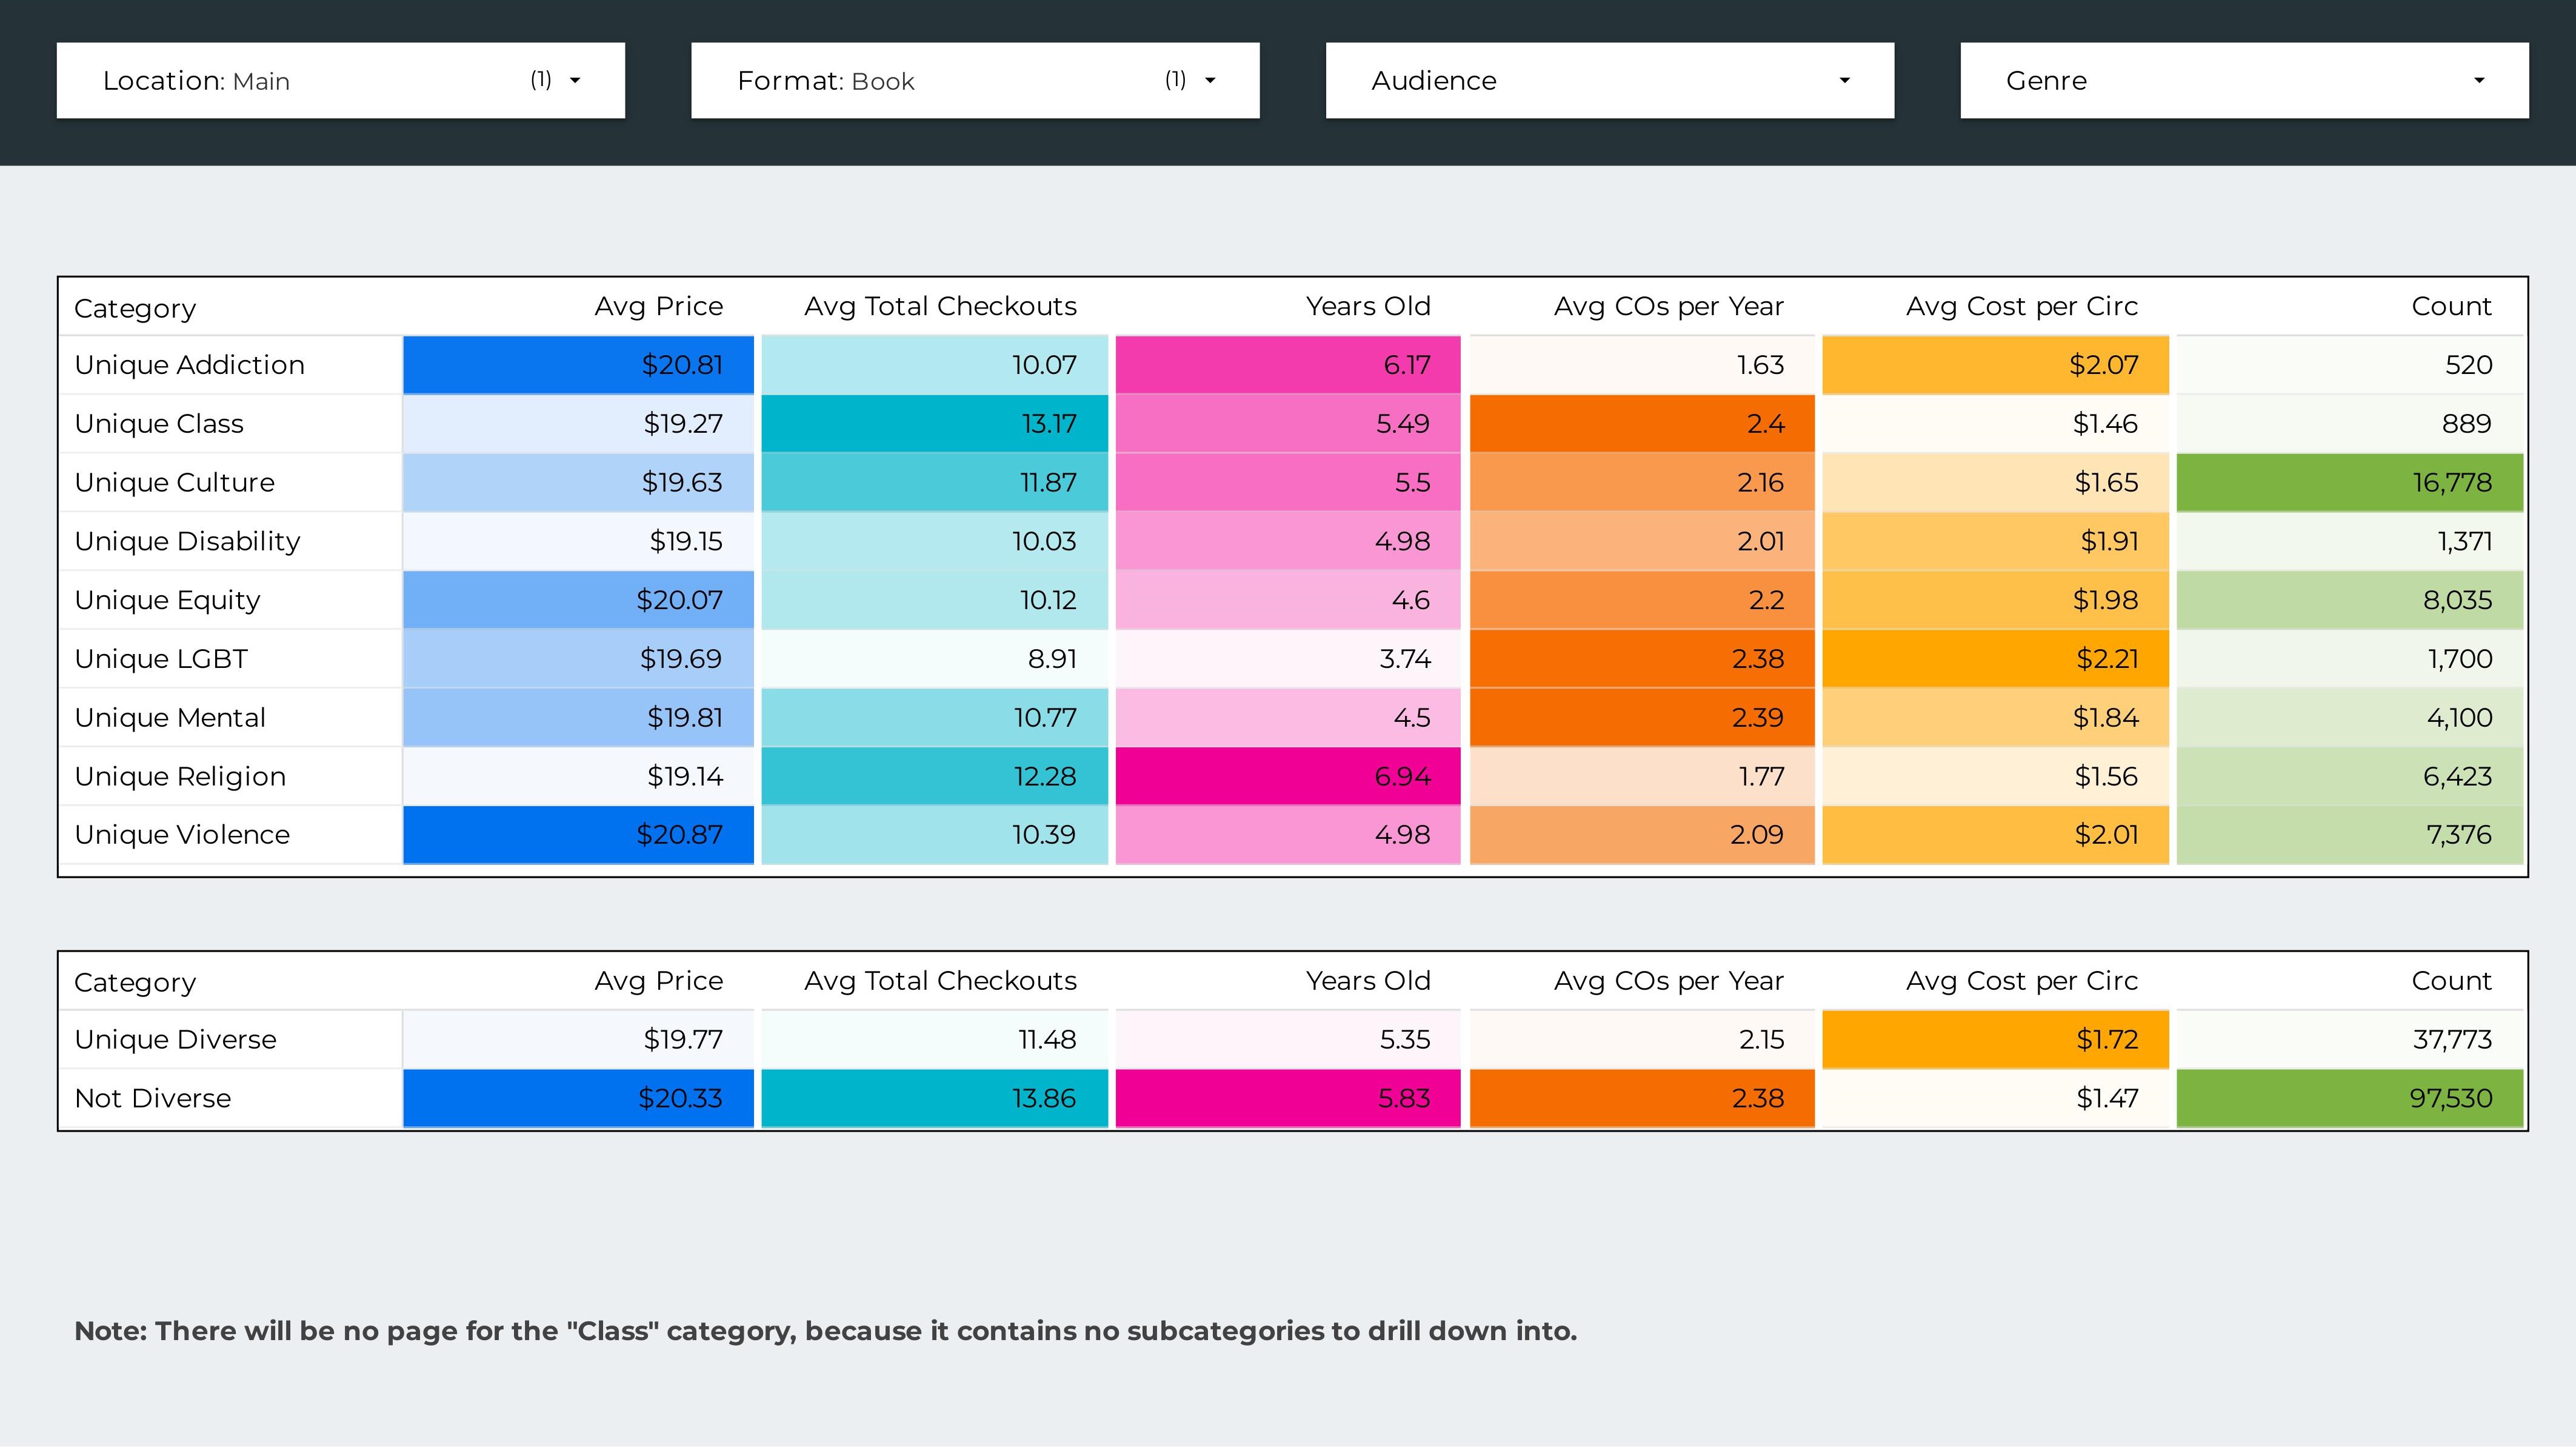
That's it! Now that you have the data, you can graph it in Looker Studio, Tableau, Power BI, or whatever you prefer.
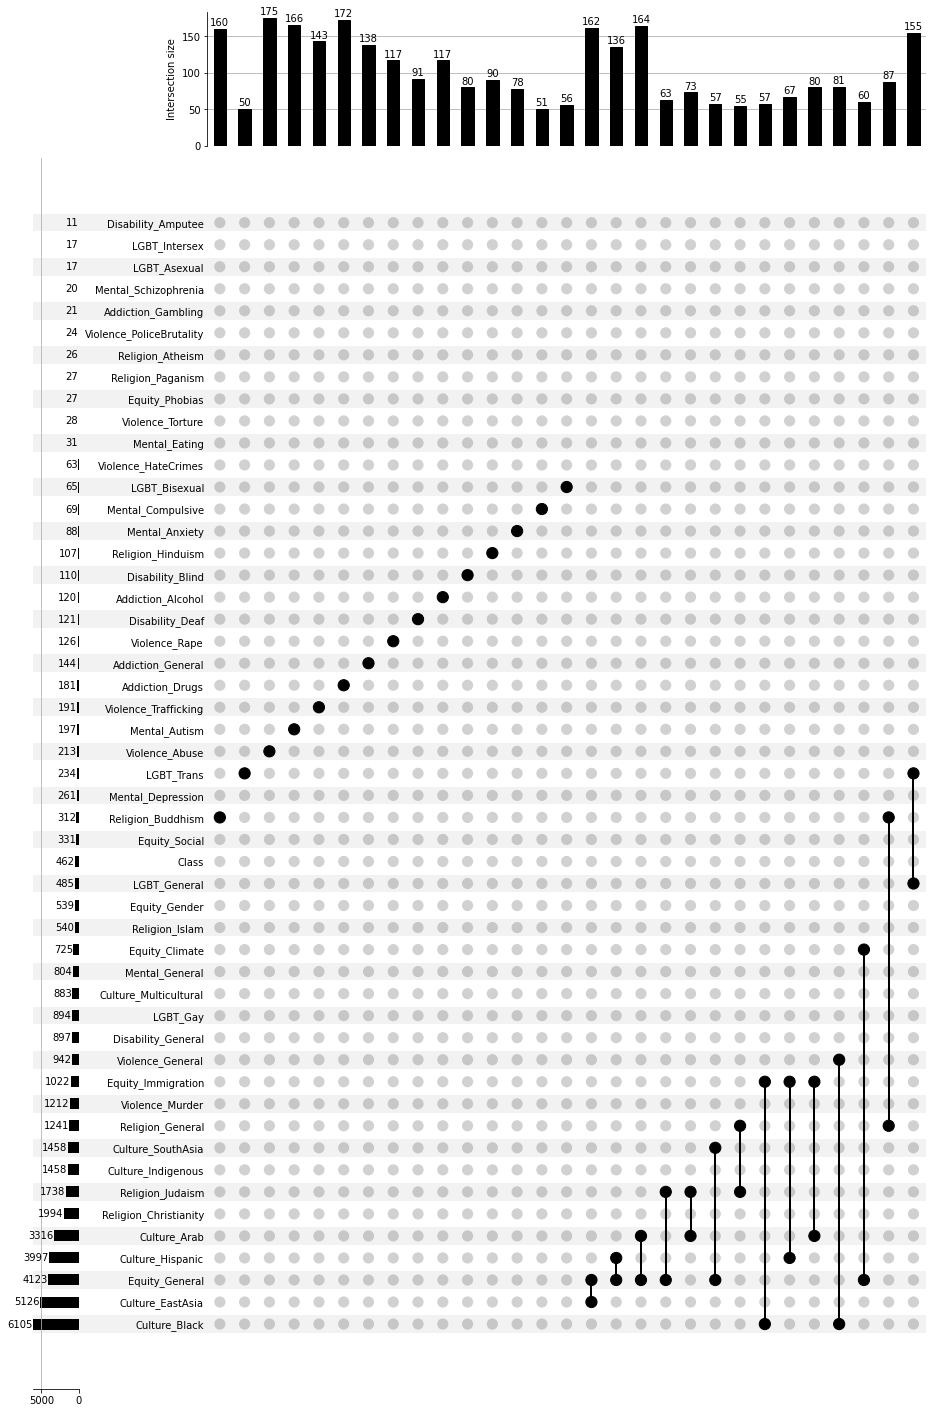
Bonus: you can use an UpSet plot to see how the different categories interact with each other. It's like a really complicated venn diagram.
from upsetplot import UpSet
from upsetplot import from_indicators
from upsetplot import plot
import pandas as pd
categories = pd.read_csv('/content/drive/MyDrive/Div Audit 11-10-22/phraseBools_11-10-22.csv')

categories[categories.columns[1:]] = categories[categories.columns[1:]].astype(bool)

colList = list(categories.columns)
inList = colList[1:]
plt = UpSet(from_indicators(inList, data=categories), show_counts=True, min_subset_size=50, max_subset_size=200).plot()
In the plot below you can see that, for example, the "Immigration" category occurred with "Black," "Hispanic," and "Arab" 57, 67, and 80 times respectively. Interesting!
Thanks for reading! If you have any comments or questions, feel free to email me at kate@kate-wolfe.com.