Networks Graphs Using Pyvis
What is a network graph?
A network graph shows you how things are connected! In our case, we are going to look at how items move from one location to another (directed), but a network can be undirected as well. For example, you can graph a fictional character's network. Who does the person appear in scenes with? How often? Who do the people they appear with, appear with? Because the relationship does not have an origin and a destination, it is "undirected."
Origins and destinations, or "sources" and "targets", are represented by nodes (circles). The lines between them are called "edges." Our network is also going to be "weighted." This means that the edges will have different thicknesses depending on how many items in transit they are representing. Additionally, the nodes will be bigger the more they are connected to other nodes.
Our Data
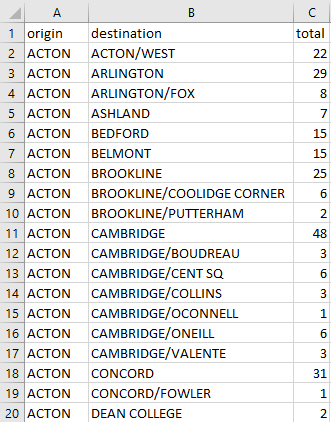
Items move between libraries to fill holds, or to return to their owning location if someone returned the item to a different library. The origin will be the library sending the item, and the destination will be the library receiving the item. The weight is the total number of items being sent in the transaction.
Our Code
Today we are using Pyvis! The code is short and sweet.
Import libraries and read in our csv file.
import pandas as pd
from pyvis.network import Network

transitEdges = pd.read_csv('transits.csv')
Condense the data for a faster/smaller graph. Here we are looking at transactions that are more than 50 items.
transitEdgesCond = transitEdges[transitEdges['total'] > 50]
Determine the format of the graph and the physics layout of the network.
transit_net = Network(height='750px', width='70%', bgcolor='#222222', font_color='white', directed=True)

transit_net.force_atlas_2based()

sources = transitEdgesCond['origin']
targets = transitEdgesCond['destination']
weights = transitEdgesCond['total']

edge_data = zip(sources, targets, weights)
Draw the network.
for e in edge_data:
    src = e[0]
    dst = e[1]
    w = e[2]

    transit_net.add_node(src, src, title=src)
    transit_net.add_node(dst, dst, title=dst)
    transit_net.add_edge(src, dst, value=w)

neighbor_map = transit_net.get_adj_list()
Add neighbor data to node hover data.
for node in transit_net.nodes:
    node['title'] += '\nNeighbors:\n' + '\n'.join(neighbor_map[node['id']])
Determine the size of our nodes by looking at the number of neighbors.
node['value'] = len(neighbor_map[node['id']])
Save and view our network.
transit_net.show('transitCond.html')
Our Graph
Here's our final graph! Zoom in and out, hover over a node to see its neighbors, or drag a node around to play with the physics.
We can see that Newton and Cambridge are sending and receiving the most items. This makes sense, since they are the largest libraries in the network. Brookline is interesting because it does big business with it's Coolidge Corner branch, but not so much with the Putterham branch. Why might that be?
Thanks for reading! If you have any comments or questions, feel free to email me at kate@kate-wolfe.com.